Sun, Feb 1, 2026
Volume 31, Issue 4 (9-2021)
JHNM 2021, 31(4): 236-244 |
Back to browse issues page


Download citation:
BibTeX | RIS | EndNote | Medlars | ProCite | Reference Manager | RefWorks
Send citation to:


BibTeX | RIS | EndNote | Medlars | ProCite | Reference Manager | RefWorks
Send citation to:
Keikavoosi-Arani L, Salehi L. Psychometric Adequacy of the Persian Version of the Performance Management Behavior Questionnaire in Universities. JHNM 2021; 31 (4) :236-244
URL: http://hnmj.gums.ac.ir/article-1-1739-en.html
URL: http://hnmj.gums.ac.ir/article-1-1739-en.html


1- Assistant Professor, Department of Healthcare Services Management, School of Health and Research Center for Health, Safety and Environment, Alborz University of Medical Sciences, Karaj, Iran.
2- Associate Professor, Department of Health Education and Promotion, School of Health and Research Center for Health, Safety and Environment, Alborz University of Medical Sciences, Karaj, Iran. ,leilisalehi@abzums.ac.ir
2- Associate Professor, Department of Health Education and Promotion, School of Health and Research Center for Health, Safety and Environment, Alborz University of Medical Sciences, Karaj, Iran. ,
Full-Text [PDF 619 kb]
(683 Downloads)
| Abstract (HTML) (1858 Views)
Full-Text: (807 Views)
Introduction
owadays, societies encounter the results of transforming from industrial age to educational age [1] {Johannessen, 2010 #1}. Higher education is responsible for responding to the needs of society and, faculty members and their performance are among the most compelling aspects of any academic educational system [2]. Indeed, the higher education system is the main element in promoting human resources in any country. Managers who work in the educational system have an essential role in the well-being of the educational performance and quality of the activities. The concept of educational quality is fundamental in the educational process [3]. Considering the organization’s limitations, scientific performance management is sensitive to quality and clarity in responsibilities [4].
Performance management contains all actions that boost efficiency in an organization [5], and it can help organizational effectiveness by supporting the organization and the staff [6]. Although performance assessment is a part of performance management, the two concepts are different. Performance management is a daily process, while performance assessment refers to an evaluation process [7].
Based on Cascio’s study on 278 multinational companies in 15 countries, 91% of organizational studies were specifically about performance management [7]. However, based on previous research, most employees do not recognize the benefits of performance management [9]. For example, only 30% of employees stated that the performance management encouraged better performance and less than 40% stated that their organization did not have clear objectives or feedback [5]. Despite interest in improving performance management in universities, few studies have examined this topic. In addition, there are many concerns about the differences between managers’ attitudes regarding performance management.
Obviously, in the absence of a valid and reliable instrument, managers encounter many problems related to performance management and its quality. As previous instruments regarding performance management are very broad or limited, an appropriate instrument for performance management behavior is necessary [9]. Kinicki et al. developed the questionnaire for this purpose with 27 items in North America in 2013. The questionnaire can be used in an educational situation [10]. Despite the importance of the Performance Management Behavior Questionnaire (PMBQ) in studying performance management behavior, it has not been validated in Iran, and there is no similar instrument in Iran. Identifying the performance management behavior of the department heads from the perspective of faculty members can recognize the managers’ strengths and weaknesses and facilitate planning to address them. This study aimed to determine the psychometric adequacy of PMBQ in higher education to assess the performance management behavior of the heads of departments in universities. The term head of department applies to appointed post holders responsible for either an academic department or school.
Materials and Methods
This cross-sectional study was conducted in four phases from October 2017 to January 2018. The first and second phases included PMBQ translation and its modifications for the educational settings. The third phase comprised the content and face validation, and the fourth phase aimed to evaluate the construct validity and reliability of the scale. PMBQ comprised 27 items and scored on the Likert-type scale from 1=rarely or never to 5=very frequently or always. This questionnaire consisted of six dimensions, including goal setting (5 items), communication (3 items), feedback (5 items), coaching (5 items), providing consequences (3 items), and monitoring performance expectations (5 items) [10].
During the translation phase and after obtaining permission from Kinicki, who developed the questionnaire, a forward-back translation was performed. At first, the original (English) version of the questionnaire was translated to Persian by two independent translators, and then this Persian version was translated to the original language by two other independent translators. Next, the two versions were compared. Then, two expert panels (each one consisting of 5 Persian educational specialists) reviewed the questionnaire, altered some items because of the cultural differences.
At the third phase, content and face validation was performed. For content validity, the Content Validity Ratio (CVR) and Content Validity Index (CVI) were computed using the opinions of 10 experts (3 health education experts, 3 medical educations experts, 2 social medicine experts, 2 management experts). In assessing the CVR, Lawshe’s table was used to compare the results. All items with an acceptable level of 0.62 or more were kept on the scale. In CVI computation, all items with the acceptable level of 0.79 or more were maintained on the scale.
Regarding face validation, the opinions of 20 faculty members were taken, and some items were changed accordingly. For face validity, both qualitative and quantitative methods were used. For quantitative analysis, 10 faculty members evaluated the questionnaire with regard to the importance of the items based on a 5-point Likert scale to calculate the item impact score [impact score=frequency (%)×importance].
To determine the underlying factors/constructs for a set of measured variables, the Exploratory Factor Analysis (EFA) was adopted, and Bartlett’s test of sphericity as an inferential statistic was used. The study population consisted of 400 faculty members (200 faculty members for EFA and 200 for CFA). Faculty members with at least one year of working background were entered the study. The sample size was considered based on Kyriazos indication (200 for sample size is fair for factor analysis) [11]. The subjects were selected with the convenience sampling method. The leading investigator administered the questionnaire and was available to answer the possible questions. Duration of 45 min was considered for all faculty members to complete the questionnaires.
Confirmatory Factor Analysis (CFA) was performed with Partial Least Squares (PLS). In the current study, smart PLS was used due to the skewness of data [12]. It also provides a data structure based on the adequacy of factor loadings (greater or equal to 0.5). For this evaluation, researchers have proposed the use of Average Variance Extracted (AVE) and extracted mean-variance (average variance of structures and their markers) for validity, Cronbach α coefficient, composite reliability for reliability, and Good of Fitness (GOF) for model fitness. The stability of the scale was assessed by calculating the Intra-Class Coefficient (ICC).
Bartlett’s test of sphericity is an inferential statistic used to assess homogeneity. Data normality was assessed with Kolmogorov–Smirnov test. The Cronbach α coefficient was applied to examine the reliability of the PMBQ. Statistical significance was set at 0. 05. SPSS version 21 and Smart PLS version 2 were used for data analysis.
Results
All 400 faculty members (200 for EFA and 200 for CFA) were studied. The mean±SD age of faculty members was 44.63±7.61 years. The characteristics of samples are listed in Table 1.
.jpg)
During the face and content validation phase, 1 item was removed since its impact score was less than 1.5, and based on Lawshe, one item, i.e., “has a communication style that causes others to become defensive”, was omitted due to a value less than 0.62 [13]. In total, 26 items were maintained in the research instrument based on the coefficient of the impact (>1.5), content validity ratio (>0.62), and content validity index (>0.7).
The sampling adequacy was tested by Kaiser-Meyer-Olkin (KMO), and a value of 0.928 was obtained [14]. Bartlett’s test was significant at χ2=2348.336, df=325, and P=0.001. Moreover, all items remained in the research tool based on the EFA. Considering eigenvalues above 1, five factors were identified that jointly explained 58.22% of the variance observed (26 items). Based on the arrangement of the factors, they were labeled as goal setting (6 items), communication (3 items), monitoring performance management (9 items), coaching (6 items), and providing consequence (2 items). The results are shown in Table 2.
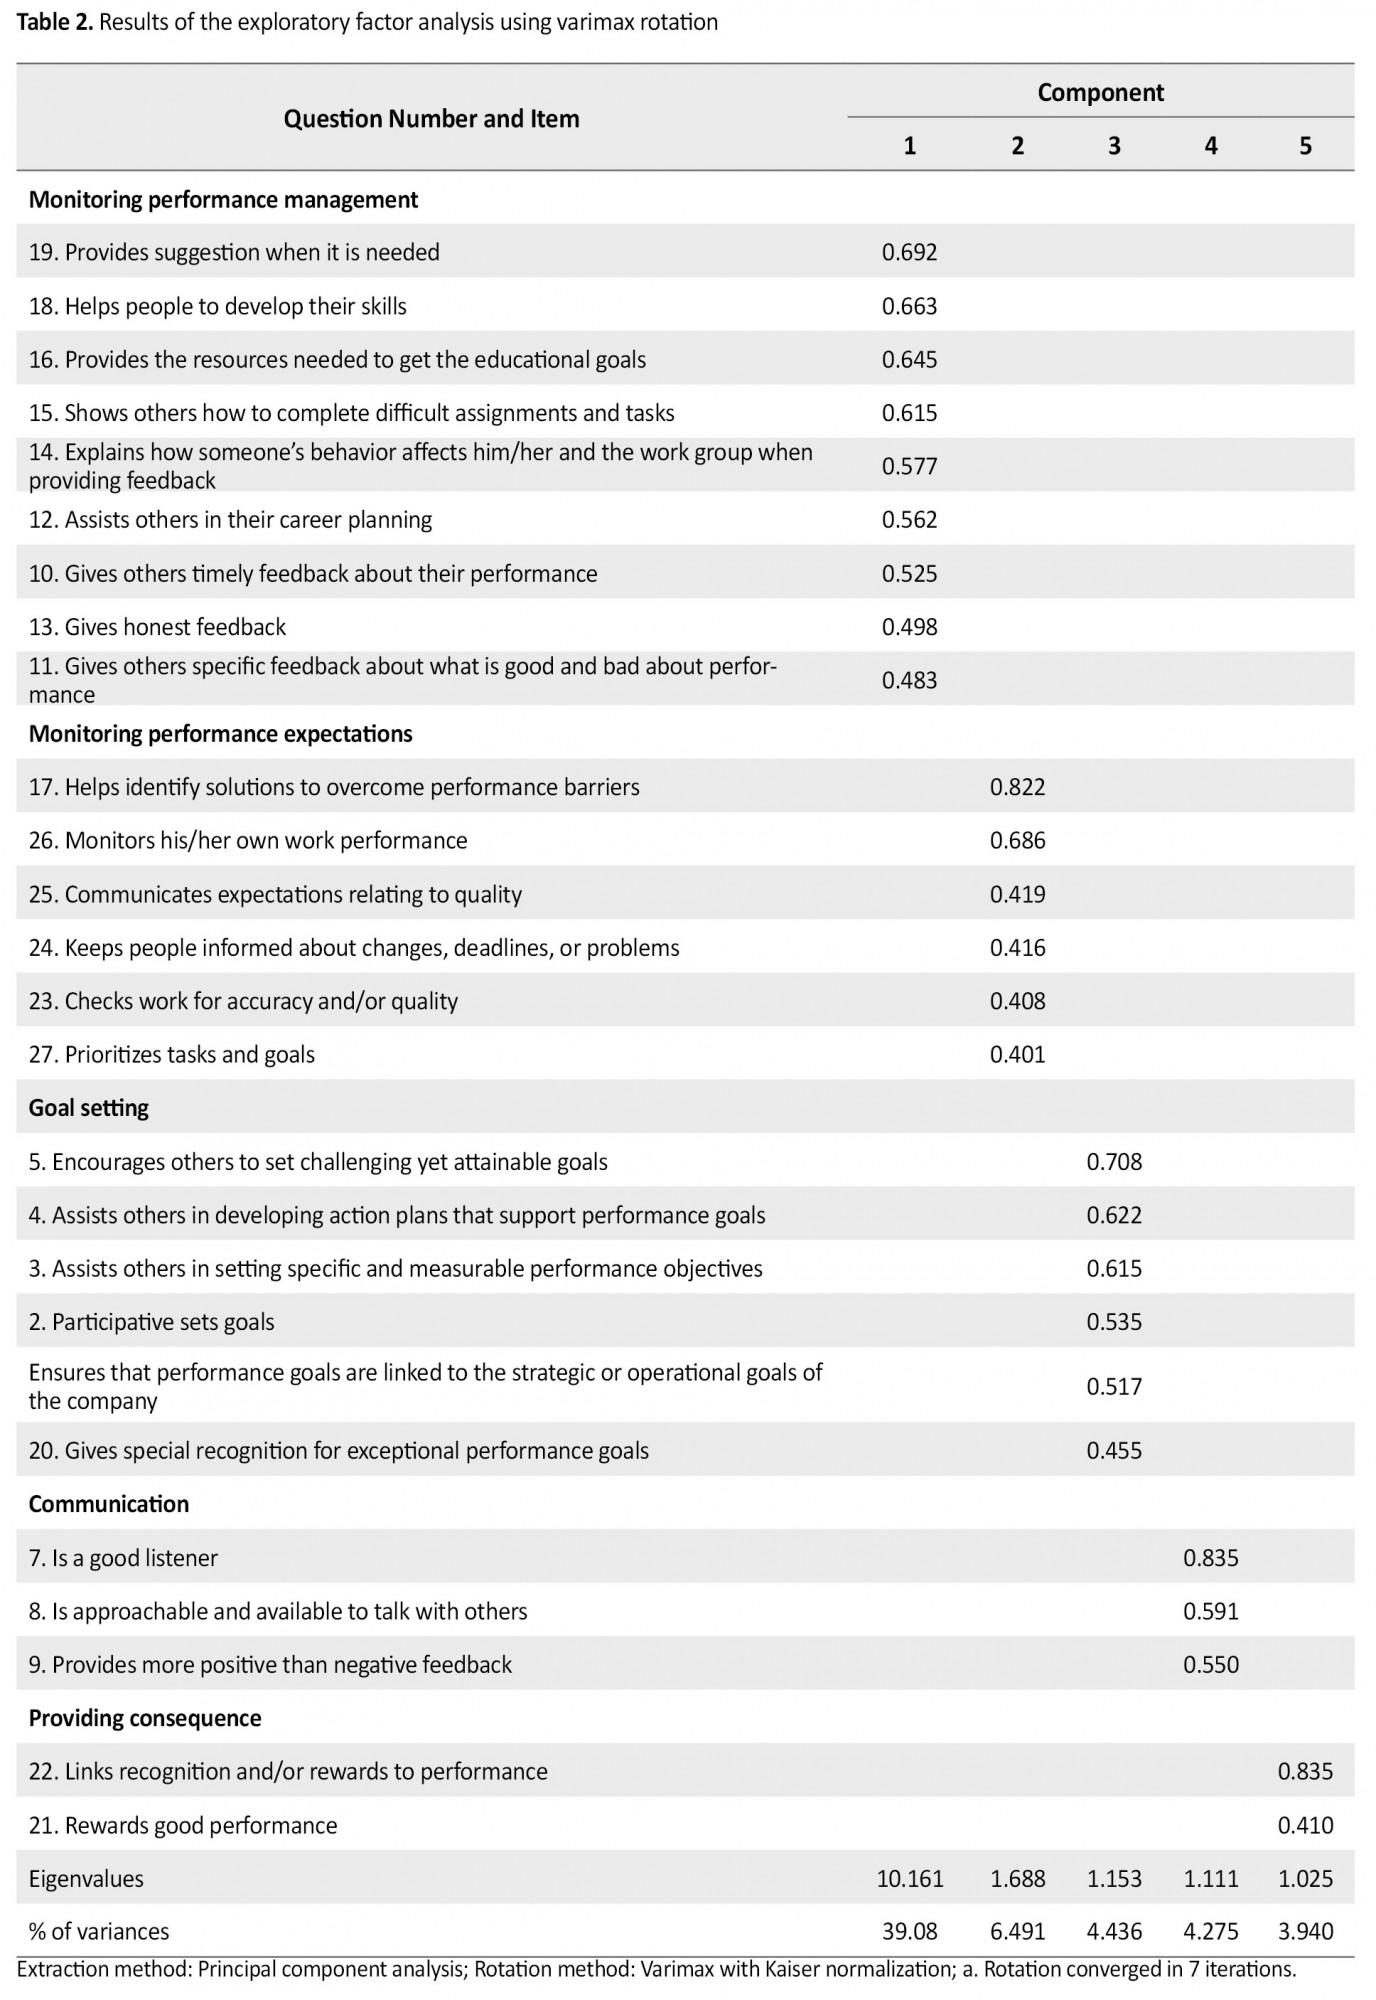
The five factors extracted based on eigenvalues and scree plot (Figure 1) could predict 58.22% of the total variances in the scale..jpg) The Cronbach α coefficient for the total questionnaire was 0.78. For the first factor (monitoring performance management), the Average Variance Extracted (AVE) was 0.6, the Cronbach α coefficient was 0.82, and the composite reliability was 0.79. For the second factor (establishing/monitoring performance expectations), AVE was 0.52, and the Cronbach α coefficient was 0.71, and the composite reliability of 0.70. For the third (goal setting), AVE was 0.51, the Cronbach α coefficient was 0.70, and composite reliability was 0.7. About the fourth factor (communication), AVE was 0.59, the Cronbach α coefficient was 0.81, and composite reliability was 0.85. For the fifth factor (providing consequences), AVE was 0.57, the Cronbach α coefficient was 0.80, and composite reliability was 0.82. ICC values varied from 0.7 to 0.75 (Table 3).
The Cronbach α coefficient for the total questionnaire was 0.78. For the first factor (monitoring performance management), the Average Variance Extracted (AVE) was 0.6, the Cronbach α coefficient was 0.82, and the composite reliability was 0.79. For the second factor (establishing/monitoring performance expectations), AVE was 0.52, and the Cronbach α coefficient was 0.71, and the composite reliability of 0.70. For the third (goal setting), AVE was 0.51, the Cronbach α coefficient was 0.70, and composite reliability was 0.7. About the fourth factor (communication), AVE was 0.59, the Cronbach α coefficient was 0.81, and composite reliability was 0.85. For the fifth factor (providing consequences), AVE was 0.57, the Cronbach α coefficient was 0.80, and composite reliability was 0.82. ICC values varied from 0.7 to 0.75 (Table 3).
.jpg)
Since the factor loading of all questions is more than 0.5 [15], this criterion is appropriate (Figure 2).
.jpg) For overall Goodness of Fit (GOF) calculation, with attention to AVE and R2 amount and by consideration of GOF formula, GOF was 0.52.
For overall Goodness of Fit (GOF) calculation, with attention to AVE and R2 amount and by consideration of GOF formula, GOF was 0.52.
Discussion
This study was conducted because of the absence of a valid and reliable instrument for PMBQ to assess the head of department behavior from the viewpoints of faculty members. The head of a department must lead, manage, and develop the department to ensure it achieves the highest possible standards of excellence in all its activities [16]. All department heads must exercise leadership, demonstrate vision, and empower others to deliver the agreed departmental strategy within the faculty [17]. Specifically, the role of the head of a department included leadership and management of staff and students, responsibility for teaching and students, responsibility for research, knowledge transfer, people management (ensuring that University HR policies and procedures are implemented such as fair workload allocation processes, staff having access to the necessary support, ensuring a safe and healthy environment for both staff and students, financial management, quality assurance (ensuring all activities are carried out to the highest possible standards), and development of academic/research standing [18].
Comparing PMBQ with similar tools was not possible due to the lack of such an instrument. Thus, researchers attempted to discuss the components of the questionnaire in an educational setting. Performance monitoring is a crucial element of performance management. In a study conducted on the management in institutes, it was shown that there could be a significant difference in the level of performance of the team and individual performance, especially in the field of learning and organizational evaluation [19].
Establishing/monitoring performance expectations is effectual in managing the effectiveness of management in the organization. Before interventions that might enhance efficiency, we need to understand employees’ expectations and capabilities [20]. Monitoring performance expectations is a core feature of effective performance management [21]. This monitoring allows the managers to observe, excite, challenge, and enhance the performance of their staff members. A performance expectation is a core feature of effective performance management systems.
A manager with performance management, compared to the traditional manager, has a better understanding of their staff and easily comprehends their thoughts and motivations [22]. Van der Hoek et al. believed that a goal must represent values, beliefs, and priorities, which should be not only capable of prediction and ease of use but also be easily measurable [23]. Furthermore, Beer and Micheli stated that objectives in the performance management process should be well defined, and stakeholders must have a role in its formulation and access to the results for decision-making [24].
The communication process involves all aspects of life, such as home, school, community, and work environment. This is an essential part of every educational process referred to as the basis for performance management. Communication as a tool in performance management creates a mutual relationship between the manager and the members, who facilitates the understanding of the demands, expectations of the organization and employees on the one hand and the transfer of requests and demands of employees to the management of the organization on the other hand. It results in the creation of an environment for the optimal use of all facilities and resources to achieve the goals of the organization. Pourkarimi et al. indicated that in the higher education system, the management of faculty members requires solid and effective communication [25].
Better performance of employees results in more interaction. Managers should, therefore, spend more time fostering a relationship of trust amongst their subordinates, as this may have benefits in terms of employees’ performance and achievement levels [26]. It is imperative that a person consistently provide appropriate feedback to all people who work with them in a team to refine their behavior and performance continuously [27]. Providing feedback is a process that provides managers with a valuable route to highlight the strengths of their staff.
There is a slight difference between this questionnaire and Kinicki’ questionnaire due to different populations. Kinicki questionnaire [10] was distributed to the staff of 75 international educational and non-educational companies, while in the present study, only it was distributed to faculty members of the educational groups in governmental and non-governmental universities in Karaj City, Iran. In this study, the views of faculty members were used as stakeholders. The use of the opinions of the faculty members leads to their increased cooperation and participation in quality promotion
The results suggest that the questionnaire has five theoretically significant dimensions: goal-setting, communication, monitoring performance, management, coaching, and providing consequences. The Persian version of the PMBQ has desirable validity and reliability. Therefore, it can be used by educational leaders and all heads of the departments in universities and other educational institutes. This questionnaire is used as a tool to study and evaluate performance management behavior.
The lack of cooperation and difficulty in having access to faculty members are among the notable limitations of the study, which were somewhat tackled by a clear explanation of the goals and benefits of the study. The novelty of the tool and the lack of a similar tool for comparing the results were among other study limitations. The researchers attempted to tackle the limitations mentioned above by documenting the importance of each domain.
Ethical Considerations
Compliance with ethical guidelines
The Ethics committee of Alborz University of Medical Sciences approved the study (Code: IR. Albzums. REC. 2017.9). Informed written consent was obtained from all faculty members after describing the aims and methods of study. The participants could withdraw from the study any time before or during the completion of the questionnaires.
Funding
This study was financially supported by Alborz University of Medical Sciences.
Author's contributions
Conceptualization, data collection, data analysis, and writing the original draft: Leili Salehi; Review and editing the final version of the manuscript and helped in data collection and analysis of the data: Leila Keikavoosi-Arani; Read and confirmed the final version of the manuscript: Both authors.
Conflict of interest
The authors declared no conflict of interest.
Acknowledgments
The authors would like to thank all participants and the Research Deputy of Alborz University of Medical Sciences.
References
owadays, societies encounter the results of transforming from industrial age to educational age [1] {Johannessen, 2010 #1}. Higher education is responsible for responding to the needs of society and, faculty members and their performance are among the most compelling aspects of any academic educational system [2]. Indeed, the higher education system is the main element in promoting human resources in any country. Managers who work in the educational system have an essential role in the well-being of the educational performance and quality of the activities. The concept of educational quality is fundamental in the educational process [3]. Considering the organization’s limitations, scientific performance management is sensitive to quality and clarity in responsibilities [4].
Performance management contains all actions that boost efficiency in an organization [5], and it can help organizational effectiveness by supporting the organization and the staff [6]. Although performance assessment is a part of performance management, the two concepts are different. Performance management is a daily process, while performance assessment refers to an evaluation process [7].
Based on Cascio’s study on 278 multinational companies in 15 countries, 91% of organizational studies were specifically about performance management [7]. However, based on previous research, most employees do not recognize the benefits of performance management [9]. For example, only 30% of employees stated that the performance management encouraged better performance and less than 40% stated that their organization did not have clear objectives or feedback [5]. Despite interest in improving performance management in universities, few studies have examined this topic. In addition, there are many concerns about the differences between managers’ attitudes regarding performance management.
Obviously, in the absence of a valid and reliable instrument, managers encounter many problems related to performance management and its quality. As previous instruments regarding performance management are very broad or limited, an appropriate instrument for performance management behavior is necessary [9]. Kinicki et al. developed the questionnaire for this purpose with 27 items in North America in 2013. The questionnaire can be used in an educational situation [10]. Despite the importance of the Performance Management Behavior Questionnaire (PMBQ) in studying performance management behavior, it has not been validated in Iran, and there is no similar instrument in Iran. Identifying the performance management behavior of the department heads from the perspective of faculty members can recognize the managers’ strengths and weaknesses and facilitate planning to address them. This study aimed to determine the psychometric adequacy of PMBQ in higher education to assess the performance management behavior of the heads of departments in universities. The term head of department applies to appointed post holders responsible for either an academic department or school.
Materials and Methods
This cross-sectional study was conducted in four phases from October 2017 to January 2018. The first and second phases included PMBQ translation and its modifications for the educational settings. The third phase comprised the content and face validation, and the fourth phase aimed to evaluate the construct validity and reliability of the scale. PMBQ comprised 27 items and scored on the Likert-type scale from 1=rarely or never to 5=very frequently or always. This questionnaire consisted of six dimensions, including goal setting (5 items), communication (3 items), feedback (5 items), coaching (5 items), providing consequences (3 items), and monitoring performance expectations (5 items) [10].
During the translation phase and after obtaining permission from Kinicki, who developed the questionnaire, a forward-back translation was performed. At first, the original (English) version of the questionnaire was translated to Persian by two independent translators, and then this Persian version was translated to the original language by two other independent translators. Next, the two versions were compared. Then, two expert panels (each one consisting of 5 Persian educational specialists) reviewed the questionnaire, altered some items because of the cultural differences.
At the third phase, content and face validation was performed. For content validity, the Content Validity Ratio (CVR) and Content Validity Index (CVI) were computed using the opinions of 10 experts (3 health education experts, 3 medical educations experts, 2 social medicine experts, 2 management experts). In assessing the CVR, Lawshe’s table was used to compare the results. All items with an acceptable level of 0.62 or more were kept on the scale. In CVI computation, all items with the acceptable level of 0.79 or more were maintained on the scale.
Regarding face validation, the opinions of 20 faculty members were taken, and some items were changed accordingly. For face validity, both qualitative and quantitative methods were used. For quantitative analysis, 10 faculty members evaluated the questionnaire with regard to the importance of the items based on a 5-point Likert scale to calculate the item impact score [impact score=frequency (%)×importance].
To determine the underlying factors/constructs for a set of measured variables, the Exploratory Factor Analysis (EFA) was adopted, and Bartlett’s test of sphericity as an inferential statistic was used. The study population consisted of 400 faculty members (200 faculty members for EFA and 200 for CFA). Faculty members with at least one year of working background were entered the study. The sample size was considered based on Kyriazos indication (200 for sample size is fair for factor analysis) [11]. The subjects were selected with the convenience sampling method. The leading investigator administered the questionnaire and was available to answer the possible questions. Duration of 45 min was considered for all faculty members to complete the questionnaires.
Confirmatory Factor Analysis (CFA) was performed with Partial Least Squares (PLS). In the current study, smart PLS was used due to the skewness of data [12]. It also provides a data structure based on the adequacy of factor loadings (greater or equal to 0.5). For this evaluation, researchers have proposed the use of Average Variance Extracted (AVE) and extracted mean-variance (average variance of structures and their markers) for validity, Cronbach α coefficient, composite reliability for reliability, and Good of Fitness (GOF) for model fitness. The stability of the scale was assessed by calculating the Intra-Class Coefficient (ICC).
Bartlett’s test of sphericity is an inferential statistic used to assess homogeneity. Data normality was assessed with Kolmogorov–Smirnov test. The Cronbach α coefficient was applied to examine the reliability of the PMBQ. Statistical significance was set at 0. 05. SPSS version 21 and Smart PLS version 2 were used for data analysis.
Results
All 400 faculty members (200 for EFA and 200 for CFA) were studied. The mean±SD age of faculty members was 44.63±7.61 years. The characteristics of samples are listed in Table 1.
During the face and content validation phase, 1 item was removed since its impact score was less than 1.5, and based on Lawshe, one item, i.e., “has a communication style that causes others to become defensive”, was omitted due to a value less than 0.62 [13]. In total, 26 items were maintained in the research instrument based on the coefficient of the impact (>1.5), content validity ratio (>0.62), and content validity index (>0.7).
The sampling adequacy was tested by Kaiser-Meyer-Olkin (KMO), and a value of 0.928 was obtained [14]. Bartlett’s test was significant at χ2=2348.336, df=325, and P=0.001. Moreover, all items remained in the research tool based on the EFA. Considering eigenvalues above 1, five factors were identified that jointly explained 58.22% of the variance observed (26 items). Based on the arrangement of the factors, they were labeled as goal setting (6 items), communication (3 items), monitoring performance management (9 items), coaching (6 items), and providing consequence (2 items). The results are shown in Table 2.
The five factors extracted based on eigenvalues and scree plot (Figure 1) could predict 58.22% of the total variances in the scale.
Since the factor loading of all questions is more than 0.5 [15], this criterion is appropriate (Figure 2).
Discussion
This study was conducted because of the absence of a valid and reliable instrument for PMBQ to assess the head of department behavior from the viewpoints of faculty members. The head of a department must lead, manage, and develop the department to ensure it achieves the highest possible standards of excellence in all its activities [16]. All department heads must exercise leadership, demonstrate vision, and empower others to deliver the agreed departmental strategy within the faculty [17]. Specifically, the role of the head of a department included leadership and management of staff and students, responsibility for teaching and students, responsibility for research, knowledge transfer, people management (ensuring that University HR policies and procedures are implemented such as fair workload allocation processes, staff having access to the necessary support, ensuring a safe and healthy environment for both staff and students, financial management, quality assurance (ensuring all activities are carried out to the highest possible standards), and development of academic/research standing [18].
Comparing PMBQ with similar tools was not possible due to the lack of such an instrument. Thus, researchers attempted to discuss the components of the questionnaire in an educational setting. Performance monitoring is a crucial element of performance management. In a study conducted on the management in institutes, it was shown that there could be a significant difference in the level of performance of the team and individual performance, especially in the field of learning and organizational evaluation [19].
Establishing/monitoring performance expectations is effectual in managing the effectiveness of management in the organization. Before interventions that might enhance efficiency, we need to understand employees’ expectations and capabilities [20]. Monitoring performance expectations is a core feature of effective performance management [21]. This monitoring allows the managers to observe, excite, challenge, and enhance the performance of their staff members. A performance expectation is a core feature of effective performance management systems.
A manager with performance management, compared to the traditional manager, has a better understanding of their staff and easily comprehends their thoughts and motivations [22]. Van der Hoek et al. believed that a goal must represent values, beliefs, and priorities, which should be not only capable of prediction and ease of use but also be easily measurable [23]. Furthermore, Beer and Micheli stated that objectives in the performance management process should be well defined, and stakeholders must have a role in its formulation and access to the results for decision-making [24].
The communication process involves all aspects of life, such as home, school, community, and work environment. This is an essential part of every educational process referred to as the basis for performance management. Communication as a tool in performance management creates a mutual relationship between the manager and the members, who facilitates the understanding of the demands, expectations of the organization and employees on the one hand and the transfer of requests and demands of employees to the management of the organization on the other hand. It results in the creation of an environment for the optimal use of all facilities and resources to achieve the goals of the organization. Pourkarimi et al. indicated that in the higher education system, the management of faculty members requires solid and effective communication [25].
Better performance of employees results in more interaction. Managers should, therefore, spend more time fostering a relationship of trust amongst their subordinates, as this may have benefits in terms of employees’ performance and achievement levels [26]. It is imperative that a person consistently provide appropriate feedback to all people who work with them in a team to refine their behavior and performance continuously [27]. Providing feedback is a process that provides managers with a valuable route to highlight the strengths of their staff.
There is a slight difference between this questionnaire and Kinicki’ questionnaire due to different populations. Kinicki questionnaire [10] was distributed to the staff of 75 international educational and non-educational companies, while in the present study, only it was distributed to faculty members of the educational groups in governmental and non-governmental universities in Karaj City, Iran. In this study, the views of faculty members were used as stakeholders. The use of the opinions of the faculty members leads to their increased cooperation and participation in quality promotion
The results suggest that the questionnaire has five theoretically significant dimensions: goal-setting, communication, monitoring performance, management, coaching, and providing consequences. The Persian version of the PMBQ has desirable validity and reliability. Therefore, it can be used by educational leaders and all heads of the departments in universities and other educational institutes. This questionnaire is used as a tool to study and evaluate performance management behavior.
The lack of cooperation and difficulty in having access to faculty members are among the notable limitations of the study, which were somewhat tackled by a clear explanation of the goals and benefits of the study. The novelty of the tool and the lack of a similar tool for comparing the results were among other study limitations. The researchers attempted to tackle the limitations mentioned above by documenting the importance of each domain.
Ethical Considerations
Compliance with ethical guidelines
The Ethics committee of Alborz University of Medical Sciences approved the study (Code: IR. Albzums. REC. 2017.9). Informed written consent was obtained from all faculty members after describing the aims and methods of study. The participants could withdraw from the study any time before or during the completion of the questionnaires.
Funding
This study was financially supported by Alborz University of Medical Sciences.
Author's contributions
Conceptualization, data collection, data analysis, and writing the original draft: Leili Salehi; Review and editing the final version of the manuscript and helped in data collection and analysis of the data: Leila Keikavoosi-Arani; Read and confirmed the final version of the manuscript: Both authors.
Conflict of interest
The authors declared no conflict of interest.
Acknowledgments
The authors would like to thank all participants and the Research Deputy of Alborz University of Medical Sciences.
References
- Kromydas T. Rethinking higher education and its relationship with social inequalities: Past knowledge, present state and future potential. Palgrave Communications. 2017; 3:1. [DOI:10.1057/s41599-017-0001-8]
- Bidabadi NS, Isfahani AN, Rouhollahi A, Khalili R. Effective teaching methods in higher education: Requirements and barriers. Journal of Advances in Medical Education & Professionalism. 2016; 4(4):170. https://jamp.sums.ac.ir/article_40973_019dbc1ea9199e3edc6e7f8b395e98c0.pdf
- Levina EY, Kamasheva YL, Gazizova FS, Garayeva AK, Salpykova IM, Yusupova GF, et al. A process approach to management of an educational organization. Review of European Studies. 2015; 7(4):234-40. [DOI:10.5539/tes.v7n4p234]
- Goudarzi G, Khosravi S, Askari R. [Performance appraisal of selected departments in Kerman university of medical sciences: A quantitative study (Persian)]. Iranian Journal of Medical Education. 2012; 12(3):193-201. http://ijme.mui.ac.ir/article-1-1747-en.html
- Carol O, Florah OM. Performance management practice and employee productivity at state department of Labor Kenya. International Journal of Business, Humanities and Technology. 2019; 9(4):20-30. [DOI:10.30845/ijbht]
- DeNisi AS, Murphy KR. Performance appraisal and performance management: 100 years of progress? Journal of applied psychology. 2017; 102(3):421-33. [DOI:10.1037/apl0000085] [PMID]
- Duda Y, Luki BN. A Comparative Review of Performance Appraisal and Performance Management. International Journal of Education and Applied Research. 2020; 10(2):12-17. https://www.researchgate.net/publication/347948725_A_Comparative_Review_of_Performance_Appraisal_and_Performance_Management
- Cascio WF. Global performance management systems. In: Stahl GK, Björkman I, Morris S, editors. Handbook of research in international human resource management. 2th ed. United Kingdom: Edward Elgar; 2012. [DOI:10.4337/9781849809191.00016]
- Awan SH, Habib N, Shoaib Akhtar C, Naveed S. Effectiveness of performance management system for employee performance through engagement. SAGE Open. 2020; 10(4). [DOI:10.1177/2158244020969383]
- Kinicki AJ, Jacobson KJ, Peterson SJ, Prussia GE. Development and validation of the performance management behavior questionnaire. Personnel Psychology. 2013; 66(1):1-45. [DOI:10.1111/peps.12013]
- Kyriazos TA. Applied psychometrics: Sample size and sample power considerations in factor analysis (EFA, CFA) and SEM in general. Psychology. 2018; 9(8):2207-30. [DOI:10.4236/psych.2018.98126]
- Wong KK. Partial least squares structural equation modeling (PLS-SEM) techniques using Smart PLS. Marketing Bulletin. 2013; 24(1):1-32. http://marketing-bulletin.massay.ac.nz
- Ayre C, Scally AJ. Critical values for Lawshe’s content validity ratio: Revisiting the original methods of calculation. Measurement and Evaluation in Counseling and Development. 2014; 47(1):79-86. [DOI:10.1177/0748175613513808]
- Hadi NU, Abdullah N, Sentosa I. An easy approach to exploratory factor analysis: Marketing perspective. Journal of Educational and Social Research. 2016; 6(1):215-23. [DOI:10.5901/jesr. 2016.v6n1p215]
- Soriano FR, Oprime PC, Lizarelli FL. Impact analysis of critical success factors on the benefits from statistical process control implementation. Production. 2017; 27:e20162040. [DOI:10.1590/0103-6513.204016]
- Pihie ZA, Sadeghi A, Elias H. Analysis of head of departments leadership styles: Implication for improving research university management practices. Procedia-Social and Behavioral Sciences. 2011; 29:1081-90. [DOI:10.1016/j.sbspro.2011.11.341]
- Al-Magableh M, Otoum A. The administrative empowerment and its relationship with the innovative behavior among the head/coordinators of the academic department at the faculty of science and arts, Sharurah–Najran University. International Research in Education. 2014; 2(2):83-106. [DOI:10.5296/ire.v2i2.6298]
- Bryman A. Effective leadership in higher education: A literature review. Studies in Higher Education. 2007; 32(6):693-710. [DOI:10.1080/03075070701685114]
- Brown TC, O’Kane P, Mazumdar B, McCracken M. Performance management: A scoping review of the literature and an agenda for future research. Human Resource Development Review. 2019; 18(1):47-82. [DOI:10.1177/1534484318798533]
- Hunt JM, Weintraub JR. The coaching manager: Developing top talent in business. 3th ed. New York: SAGE Publications; 2016. [DOI:10.4135/9781071801345]
- Grant AM, Hartley M. Developing the leader as coach: Insights, strategies and tips for embedding coaching skills in the workplace. Coaching: An International Journal of Theory, Research and Practice. 2013; 6(2):102-15. [DOI:10.1080/17521882.2013.824015]
- Whitmore J. Coaching for Performance: Growing Human Potential and Purpose-The Principles and Practice of Coaching and Leadership. 4th ed. London: Nicholas Brealey Publishing; 2009. [DOI:10.1177/0974173920100216]
- Van der Hoek M, Groeneveld S, Kuipers B. Goal setting in teams: Goal clarity and team performance in the public sector. Review of Public Personnel Administration. 2018; 38(4):472-93. [DOI:10.1177/0734371X16682815] [PMID] [PMCID]
- Beer HA, Micheli P. How performance measurement influences stakeholders in not-for-profit organizations. International Journal of Operations & Production Management. 2017; 37(9):1164-84. [DOI:10.1108/IJOPM-08-2015-0481]
- Pourkarimi J, Farzaneh M, Azizi M, Kordi E. [Designing a professional competencies model for educational departments’ heads in University of Tehran (Persian)]. Higher Education Letter. 2016; 9(34):149-70. http://journal.sanjesh.org/article_23697.html?lang=en
- Beekes W, Otley DT, Ururuka V. The use and consequences of performance management and control systems: A study of a professional services firm. Research Executive Summary Series. 2010; 6(10):1-6. https://www.semanticscholar.org/paper/The-use-and-consequences-of-performance-management-Ururuka/74735749d4d9b87daed5f9de160fdebd3c9109cb
- Hardavella G, Aamli-Gaagnat A, Saad N, Rousalova I, Sreter KB. How to give and receive feedback effectively. Breathe. 2017; 13(4):327-33. [DOI:10.1183/20734735.009917] [PMID] [PMCID]
Article Type : Applicable |
Subject:
Special
Received: 2021/10/29 | Accepted: 2021/08/4 | Published: 2021/10/1
Received: 2021/10/29 | Accepted: 2021/08/4 | Published: 2021/10/1
Send email to the article author
| Rights and permissions | |
 | This work is licensed under a Creative Commons Attribution-NonCommercial 4.0 International License. |
Copyright © The Author(s);
This is an open access article distributed under the terms of the Creative Commons Attribution License (CC-By-NC), which permits use, distribution, and reproduction in any medium, provided the original work is properly cited and is not used for commercial purposes.
Contact Information